Nortel trace diagnostic
Diagnose Nortel (Avaya) 8600 CPU trace files
Or any other log file (Linux / Apache / Routers / Firewalls ..)
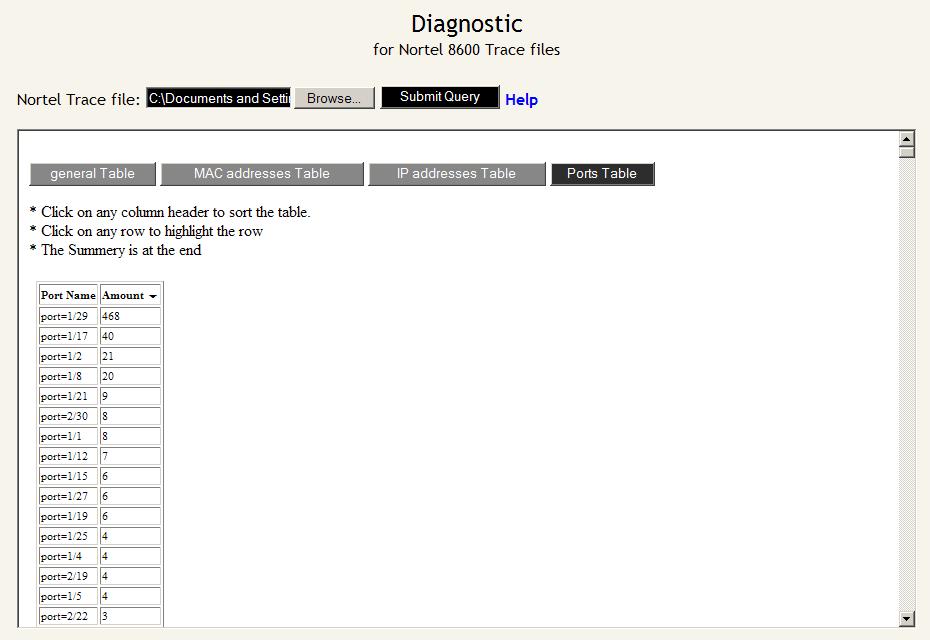
Finds how many times each port, IP and MAC is in the log file,
In case of high CPU, port / IP / MAC that appears most can cause it
This tool has been decommissioned as part of the migration to the new cloud environment.
Help
If you have high CPU load on your Nortel ERS 8600 (passport 8600)
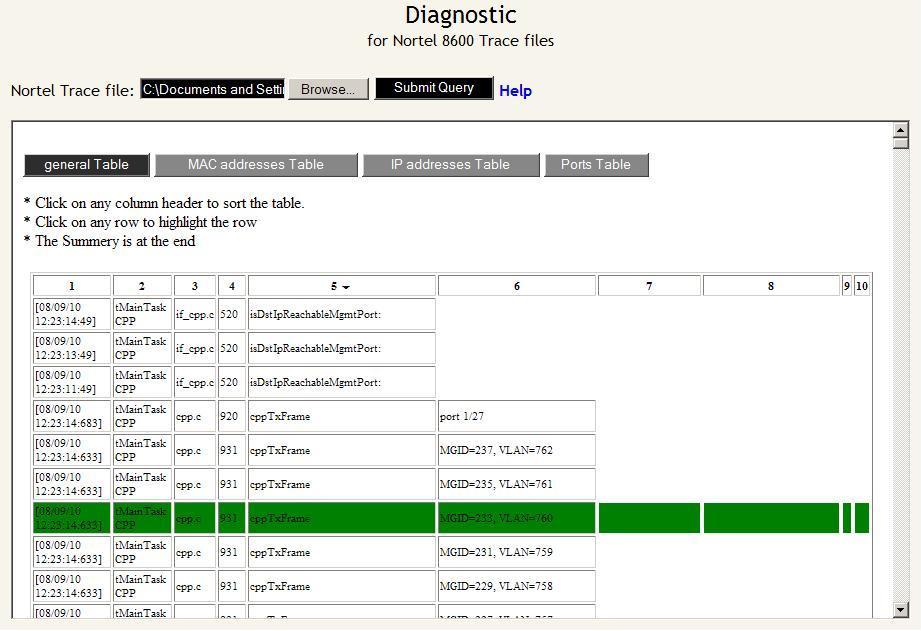
This tools shows the Trace file as a sortable table
very helpful to determine, analyze, diagnose what is causing such high load
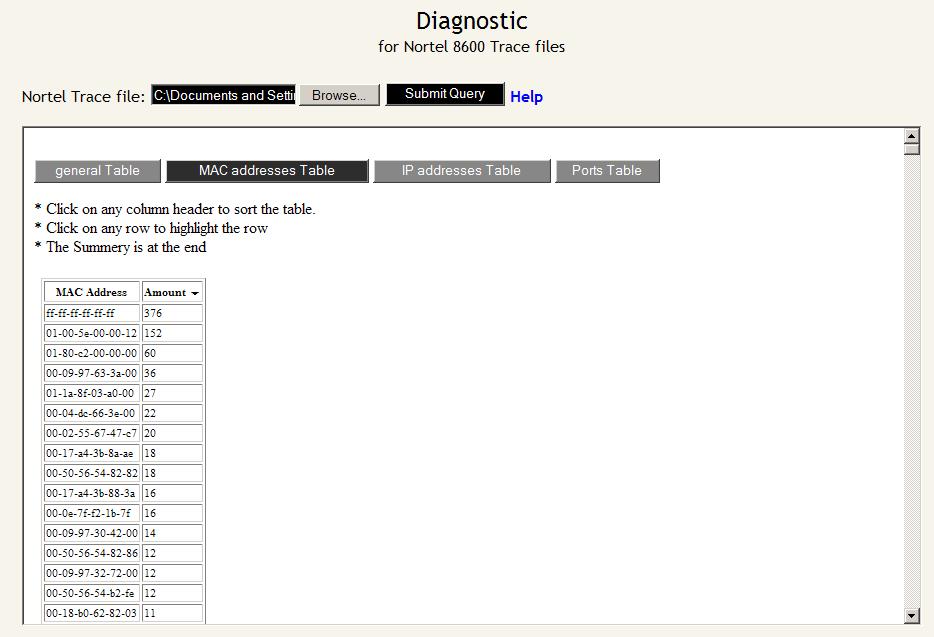
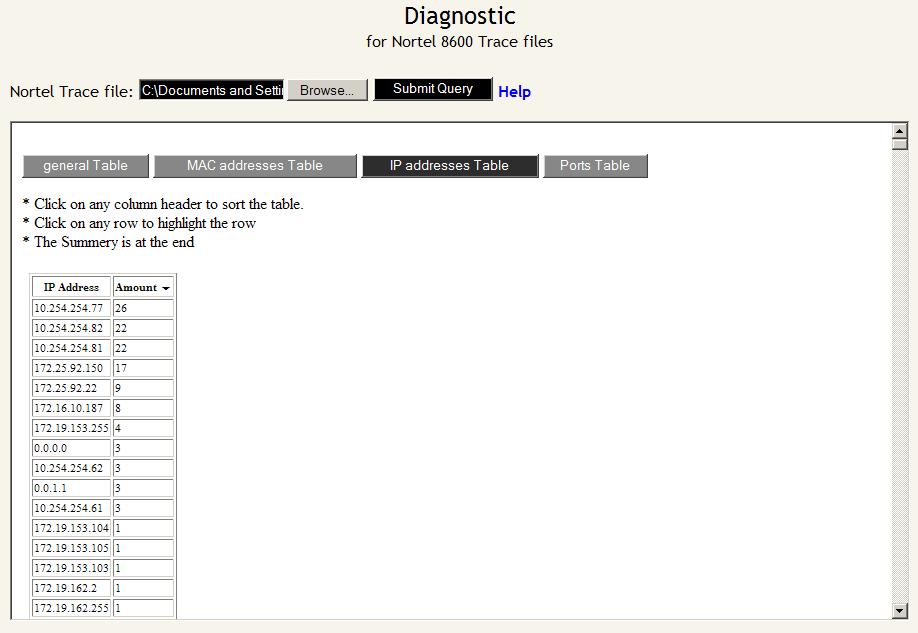
also you can see a sortable table of MAC addresses, IP addresses and Ports
on eatch table you can find the amount of every MAC/IP/Port that appears at the trace file
To do a trace at 8600 enter the following commands:
| trace clear trace screen off trace level 9 3 wait a minute or two and start to log the session (save the output to log file) trace off trace info |
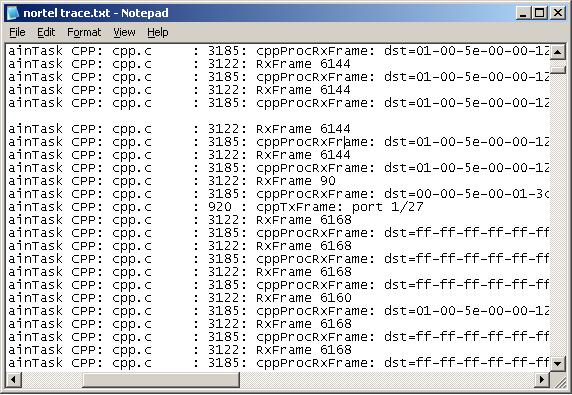
after that you enter the ‘info’ you will see alot of lines that shows what the CPU was doing at that time
Tip:
To check the CPU status use the command-
| show sys perf |
Examples:
 |
 |
 |
 |
 |
I am genuinely delighted to read this blog posts which carries plenty of helpful data, thanks for providing these statistics.